
Baseball Analyst archives
This article was written by SABR
Index for “Baseball Analyst”
Nos. 1-40, 1982-1989
Read Rob Neyer’s introduction of the Baseball Analyst archives.
Click on an issue below to download the text-searchable PDF file.
Special thanks to Bill James and Phil Birnbaum for making these files available.
Index compiled by Stephen Roney, Charles Pavitt, Pete Palmer, Cliff Blau, Bill Deane, Dan Heisman and Barry Mednick.
Issue 1-June 1982
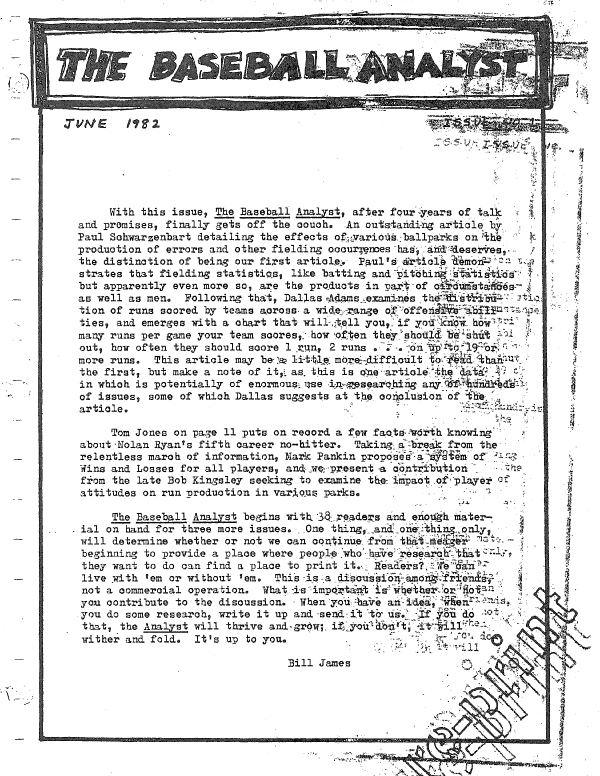
- Introduction
by Bill James, p. 1 - Ballpark Effects on the Production of Infield Errors and Double Plays
by Paul W. Schwarzenbart, p. 2-7
Using data from the NL from 1972,3,6,8,9, and 80, presents home/road rates and ratios for infield and outfield errors and double plays and analysis of the results - The Distribution of Runs Scored
by Dallas Adams, p. 8-10
Using data from 1967-76 from both leagues, presents % of games teams score a given number of runs from 0 to 19+. Teams are lumped into 11 groups based on average runs per game. A graph presents the same data as the table. 2 formulas are given to predict the distribution of runs for any team given its average scoring rate. One is for 5 or fewer runs in a game, the other for 6 or more. - Nolan Ryan’s Fifth No-Hitter
by Tom Jones, p. 11
Account from box score of the 9/26/81 game - Wins and Losses For All Players
by Mark D. Pankin, p. 12-14
Describes a method of assigning wins and losses to pitchers and hitters. No statistics or actual examples given. Wins are given only to players on winning team and vice versa. - Home Runs – A Matter of Attitude
by Robert Kingsley, p. 15-20
Examines the reasons more home runs are hit at some parks than others, using Atlanta Fulton County Stadium and Busch Stadium for illustrative purposes. Concludes 3 main factors are physical dimensions, climate, and hitter attitude. Statistics given for home and road homers for and against Braves and Cardinals for 1976, 7, and 8.
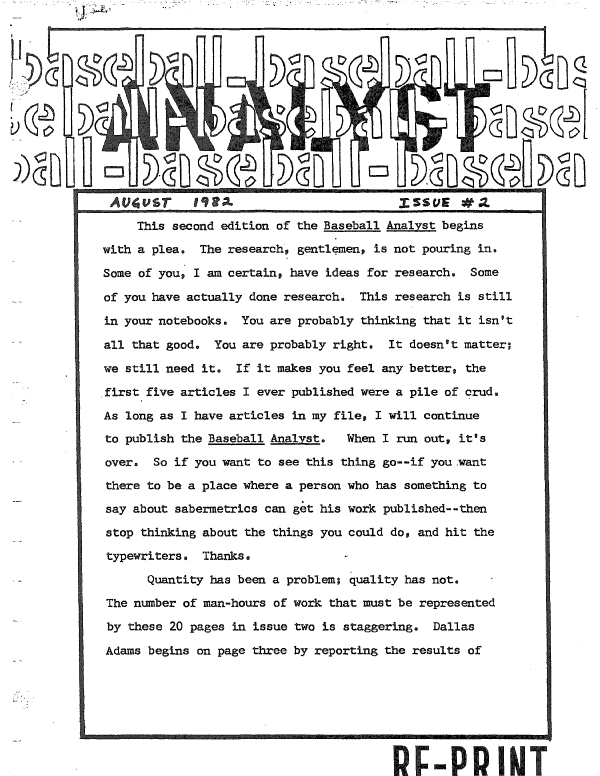
Issue 2-August 1982
- Introduction
by Bill James, p. 1-2 - Some Patterns of Age and Skill
by Dallas Adams, p. 3-9
Data presented for all non-pitchers who finished their careers between 1901 and 1968. Gives data for each age from 16 to 46:total games, % of games, number of players, games per player, number of players playing 95 or more games, and % playing 95 or more games. Next table gives same data for Hall of Famers included in table 1. Table 3 gives same data for catchers included in table 1. Much of these data are presented in graph form, too. - Ballpark Effects on Fielding Performance:Further Evidence
by Craig Wright, p. 10-12
Uses NL data from 1976-80 to compare double play rates on grass versus artificial turf. Speculates that ground balls are more prevelent on grass fields and thus the effect on fielding average is slightly less than the effect on errors. - Run Production by Batting Order Position
by Dick O’Brien, p. 13-14
For 1981, presents RBI by batting order position and % of RBI by batting order position. Also same info given for pinchhitters and other subs. Compares actual RBI performance for a select group of number 3 and 4 hitters to their expected RBI. Detailed comments on Steve Garvey and Dave Winfield. - Clutch Hitting
by Dick O’Brien, p. 15-16
Gives average runs per HR for each batting order position and compares % for each to cleanup slot. Based on players with at least 100 HR up to 1974. Gives runs per HR for about 3 dozen sluggers. - In Search of the “True” Slugging Percentage
by Jim Morrow, p. 17-19
Presents formula for runs produced based on average number of runs scored and driven in per each type of hit as well as walks. Its correlation with actual runs is slightly less than slugging averaage’s. - The Effects of Overwork on Young Pitchers
by Dallas Adams, p. 20
Concludes that overworking rookie pitchers significantly shortens their careers. Presents table innings pitched in each of first four years for 3 groups based on number of games pitched as rookie.
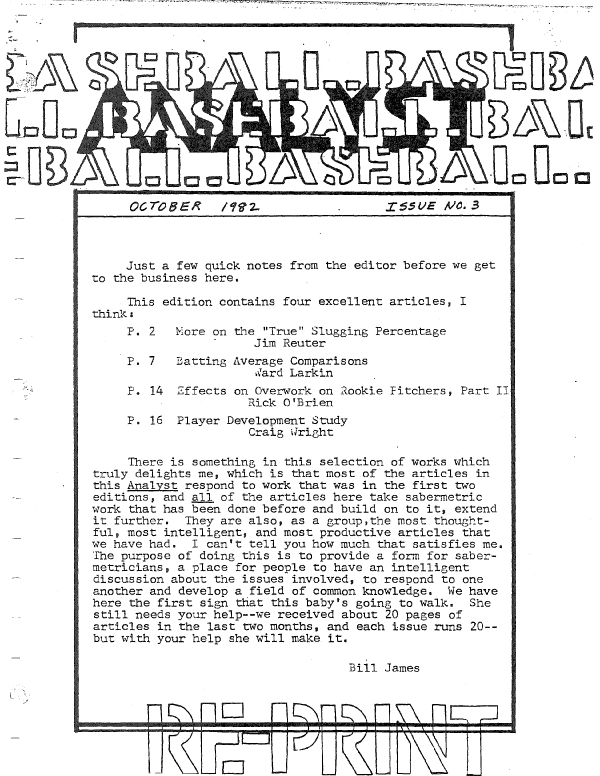
Issue 3-October 1982
- More on the “True” Slugging Percentage
by Jim Reuter, p. 2-6
Responding to an article by Jim Morrow in the previous issue, and measuring the value of home runs and doubles in “true” slugging percentage. - Batting Average Comparisons
by Ward Larkin, p. 7-13
Studying batting average in different eras. - Comment on “Effects of Overwork of Rookie Pitchers”
by Ward Larkin, p. 11
Responding to an article by Dallas Adams in the previous issue. - Effects of Overwork on Rookie Pitchers, Part II
by Dick O’Brien, p. 14-15
Studying if age has any effect on the conclusions made in Dallas Adams’ article in the previous issue. - Player Development Study
by Craig Wright, p. 16-19
Responding to a 1981 study by Bill James on farm systems and the value of their performance, and the effect of the Major League Scouting Bureau. - Comment on Larkin, “Batting Average Comparisons”
by Bill James, p. 20
Responding to Ward Larkin’s article on page 11 of this issue.
Issue 4-December 1982
- Introduction
by Bill James 2-3 - Measuring Relief Performance
by John Billheimer, p. 4-12
Evaluates relief pitchers in 1981 according to Prorated ERA (PERA) which charges relievers for a share of inherited runners they allow to score, and Slips (similar to blown saves.) Gives stats for teams and individuals. - Some Additional Aspects of the Distribution of Runs Scored
by Dallas Adams, p. 13-16
Updates article from Issue 1 with data from 1977-81. Also discusses probability of scoring a given number of runs in an inning or per out. - Commentary on prior article
by Bill James, p. 17
Compares actual # of times Yankees and A’s scored a given # of runs in an inning to theoretical results using Adams’ formulas. - A New Look at “Hard Luck” Pitchers
by Mark Lazarus, p. 18-22
Gives team errors behind starting pitchers for 1982. Also breaks down overall errors by position and for left/right handed pitchers. - Thoughts on Isolated Power
by Jim Reuter, p. 23-24
Introduces Adjusted Isolated Power (AIP) which equals slugging average minus batting average divided by (1 minus batting average.) Also equal to extra bases per out. Gives top 20 career leaders and top 10 for first 4 20 year periods of this century.
Issue 5-February 1983
- Introduction
by Bill James, p. 2
Philosophies of publication and plea for material. - Effect of Batting and Pitching Changes on Team Change In Won-Lost Record
by Dick O’Brien, p. 3-5
Examination of 1969-82 teams which improved or declined by at least five games from one year to the next. Were they effects of improvements/declines in hitting, pitching, or both? Are the results different when separated by teams in hitters or pitchers parks? - Home Park Factors
by Jim Reuter, p. 6
General formula to adjust a players statistics based on his home park. - Balls and Strikes
by Pete Palmer, p. 7-8
Examination of pitch-by-pitch data from 1974-77 post-season series. What is the effect of the ball-strike count on a batters batting, on-base, and slugging averages? How can this data be used to evaluate strategies such as pitch-outs, sacrifices, or swinging at 3-0 pitches? - Some Further Aspects of the Distribution of Runs Scored
by Dallas Adams, p. 9-20
Continuation of an article in the previous issue. Examines the probabilities of teams scoring and/or winning based on score, inning, and number of outs. Includes many equations, tables, and graphs.
Issue 6-April 1983
- Ballpark Effects on Fielding Statistics — American League Parks
by Paul W. Schwarzenbart, p. 2-5
Follow-up to article in issue #1. Uses various data between 1972-80 to examine the effect of different AL parks on errors (by both infielders and outfielders) and double plays. Key point of discussion is the effect of grass vs. turf fields. - Quality Versus Quantity
by Dan Heisman, p. 6-9
What is the effect of quantity (i.e., career value) vs. quality (peak value) in Hall of Fame voting? In actual value to a players team? Includes examination of the best five years of 31 past and present stars. Editors comment on p.20. - Team Won/Lost Percentage as a Function of Runs and Opponents Runs
by Dallas Adams, p. 10-12
Follow-up to articles in previous issues. Uses 1967-76 game scores to determine teams probability of winning based on number of runs scored and allowed. Includes tables and equations. - Adjusted Home Park Factor
by Pete Palmer, p. 13-16
Computation of home park effect, with commentary on Reuters article in previous issue. Includes table showing home/road data in runs and home runs for 1977-82. Editors comment on p. 20. - Evaluating Pitchers Performances
by Cuthbert Magnolia, p. 17-19
Tongue-in-cheek article with serious formulas for rating starters and relievers, by comparing them with pitchers in their league and on their team.
Issue 7-August 1983
- New Editors Notes
by Jim Baker, p. 2
Introduction from publication’s new editor, and plea for material. - Letter
by Mrs. B. Kwandrie, p. 3, 8
Letter to the editor, apparently fictitious and created to encourage real letters to the editor. - Run Production By Batting Order Position — Part II
by Dick O’Brien, p. 4
Follow-up to article in August 1982 issue. Examination of 1978-82 boxscores to reveal individual runs scored and RBI by position in the batting order. - On the Probability of Hitting .400
by Dallas Adams, p. 5-7
Examination of the probability of an individual batting .400 for a season, based on the league batting average. Includes graphs. - A Trend Analysis of Batting Averages
by Gary T. Brown, p. 8-17
Examines league batting averages over the years, illustrated by graphs. Offers explanations for changes over the years, and projections for the future. - The Chalmers Award Born Anew!
p. 13
Announcement of a mythical MVP-type award sponsored by the publication, and voted on by the readers. - Assigning Relative Values To Relief Wins, Losses and Saves
by John Schwartz, p. 18
Offers an alternative method of rating relievers weighting wins, losses, and saves based on the frequency of each. - Distribution of Runs
by Pete Palmer, p. 19-20
Analyzes the distribution of runs, citing many previous studies on this subject. Examines 1980-82 AL data in testing formulae, and illustrates the effect random chance can have on statistics.
Issue 8-October 1983
- Editor’s Note
by Jim Baker, p. 2
Satirical “tabloid” style story about 1983 World Series - Letter from Dallas Adams
p. 4
Discussing distribution of runs scored and team scoring efficiency - Introducing Project Scoresheet
by Bill James, p. 5-6
Proposes the organization which collected play-by-play data for all games for several seasons. - Scoring Sequences
by Barry L. Mednick, p. 7-8
Based on 3 weeks worth of games by the Giants and A’s. Gives % of time a given offensive event was associated with a run. - On Handedness and Pitchers’ Fielding
by Warren Johnson, p. 9-14
Gives range factors for 1982 ERA title qualifiers and discusses the reasons for differences between leagues and right/lefties. Range factor used here is changes accepted per batted ball out. - Pitchers’ Range Factors
by Clem Comly, p. 15
Gives leaders and trailers for 1982 and period 1974-82. Range factor used here is chances accepted per 27 batted ball outs. - Power Hitters Strikeout/Home Run Ratios
by Dick O’Brien, p. 16-17
For the period 1920-82 and 1970-82, for all players driving in at least 100 runs in a season, groups hitters by strikeout/hr ratio. Gives percentage of total for each of 6 groups. For the latter period, gives k/hr ratio for two other groups-those with at least 20 HRs but fewer than 100 RBIs and those with at least 20 HRs but fewer than 70 RBIs. These two groups had higher ratios than the first group. - On Foul Balls
by David Aceto, p. 18-19
Discusses the theoretical effect on batting averages of foul outs. No actual data given. - The Left Handed Hitter’s Advantage
by John Schwartz, p. 19
Gives the distance between home and the other bases that must be run by left and right handed hitters. Lefties have a 5% advantage running to first. - Humorous review of fictional film about Max Patkin
by John Borkowski and Jim Baker, p. 20
Issue 9-December 1983
- Editor’s Note
by Jim Baker, p. 2 - Review: “The Hidden Game of Baseball”
Book Review - The Best Fielding Second Baseman Since 1925
by Dan Finkle, p. 4-8,19
Mazeroski,Bill; Schoendienst,Red; Doerr,Bobby; Gordon, Joe; Trillo,Manny; Critz,Hugh; Gehringer,Charlie; Melillo,Oscar; Fielding; Second Baseman; Fielding Index; Double Plays; Errors - The Worst
by Joe Ferrere, p. 9
On John Gochnaur - Functions for Predicting Winning Percentage from Runs
by Charles Hofacker, p. 10-16
Won-Lost Record;Run Production;Pythagorean Projection - Assists versus Strikeouts
by Barry Mednick, p. 17
Assists;Strikeouts;Range Factor - An Analysis of Win Percentage
by Bill Deane, p. 18-19
Carlton, Steve;Guidry, Ron Won-Lost Record;Wins Above Team;Pitcher Performance Percentage
Issue 10-February 1984
- Old Baseball Pie
by Mike Ross, p. 2-3
Recipes;Humor - A Critique of “The Best Fielding Second Basemen since 1925”
by Dick O’Brien, p. 4-5
Fielding; Second Baseman;Double Play - The Contenders During the Pressure Month – September
by Jack Carlson, p. 6-11
1983;Pennant Race - Minors 1983:Pitcher’s or Hitter’s Leagues
by Larry Smith, p. 12
1983;Minor Leagues - A Comparison of Baltimore’s September Pennant Drive With Their Performance During the Rest of the Season
by Barry Mednick, p. 13-14,17
1983;Pennant Race;Baltimore Orioles - The Difference Between Night and Day
by Paul Schwarzenbart, p. 15-17
Day/Night - Commentary on Schwarzenbart’s “Night and Day”
by Bill James, p. 18
Day/Night - A National League Rating System
by Joe Levy, p. 19-20
Ratings;Evaluations
Issue 11-April 1984
- Mays vs. Aaron: A New Look
by Bill Deane, p. 4-6
Statistics: “Production”; “Star”; “SuperStar”; Home/Road HR comparison Topics: Comparing Aaron and Mays career stats in many categories - The Best Fielding Third Basemen Since 1925
by Dan Finkle, p. 7-9; 20
Consecutive years of selection; Range, DP; Fly Ball, and Misplay Index; Overall Index Named Person(s): Buddy Bell, Mike Schmidt, Brooks Robinson, Ron Santo, Eddie Mathews, Sal Bando, Clete Boyer, Rodriguez, Ken Keltner, Kamm, Whitney; Harland Clift, Graig Nettles Comparing modern 3rd baseman on a variety of fielding stats - Statistical Procedures for Baseball Research I: Correlation and Simple Regression
by Charles Pavitt and Elaine M. Gilby, p. 10-15
Correlation Computations for Pitchers Named Person(s): Steve Carlton, Bob Knepper, Phil Niekro, Rick Rhoden, Steve Rogers, Dick Ruthven, Tom Seaver, Mario Soto, Bob Walk, Bob Welch Using correlation and linear regression to find the relationship between baseball stats - Minor League Effects on Major League Pitching Performances
by Terry Bohn, p. 16-17
Table of Poor, Average, and Star Pitchers with Below AAA and “AAA” stats compared Looking for patters as to whether minor league success for pitchersindicated success at the major league level - On the Importance of Getting the Leadoff Batter on Base
by Chuck Waseleski, p. 18-19
Red Sox and Opponents 1983 Runs Scored (Number and Frequency) vs. Whether batter reached first; Runs in a game vs. number of innings the leader batter got; Base Reached by Leadoff Batter vs. Number of Runs Scored. Looking at how teams performed in runs scored vs. how the leadoff batter performed
Issue 12-June 1984
- The Metrodome and Home Runs
by Terry Bohn, p. 4
Metrodome; Home Runs;Park Factor - Is Artificial Turf More Offensive?
by Robert S. Smith, p. 5-10
Artificial Turf; Park Factor - The Pythagorean Theorem and Twenty-Two Recent Managers
by David F. Hoppes, p. 11-13
Weaver, Earl;Lasorda, Tommy;McNamara,John Managers;Pythagorean Projection - Four-Decade Candidates for 1990
by Daniel Greenia, p. 13
Four-Decade Players;Longevity - When Games End and What That Tells Us
by Clem Comly, p. 14-17
Simulations;Line Up;Pinch-Hitting;Run Production - Criteria for Hall of Fame Selection
by Dan Rappoport, p. 18-20
Hall of Fame;Runs Batted In
Issue 13-August 1984
- Letter-comment on “Statistical Procedures for Baseball Research I: Correlation and Simple Regression”
by Dan Rappoport, p. 4-5 - Letter
by Charles Pavitt, p. 5
On Double Plays - Dan Greenia’s Freak Show: Stealing Contribution
by Dan Greenia, p. 5
On Stolen Bases - Some Comments on the Benefit of Getting the Leadoff Batter on Base
by Charles Hofacker, p. 6,16
Leadoff; Run Production - “The Natural”: Strictly Artificial
by Chris Martens, p. 7
Review: “The Natural” - Joe D And The Halo Effect
by Bill Deane, p. 8-9
DiMaggio, Joe - The Righetti Decision – A Historical Perspective
by Art Springsteen, p. 10-16
Righetti, Dave; Relief Pitcher - One Adjustment to the Range Factor
by Tim Marcou, p. 17-19
Range Factor
Issue 14-October 1984
- Base on Balls Abstract, Part I
by Craig Wright, p. 4-9
Table of Dodger stats for the three years they scored more than 100 runs more than any other team in the league (’49; ’50; ’53); Table of league offensive stats broken down by top, middle and lowest players in unintentional BB. Plate Appearance Distribution for Bases Empty (not-leading off), Leading Off an Inning, Runners in Scoring Position, and Men on First Only vs. Hi/Med/Lo BB men for 1983. Several other tables with similar distribution information showing value of the BB, affect of BB ability to do “what is most valuable in a situation”; clutch-situation ability, comparing individual players in Late-Inning Pressure situations, etc. Table of “Situational Stats for ’83 AL players with 400+ PA separated into non-intentional BB average into three equal groups” Research of Walk Values (de-bunking myths about BB, etc.) - Unforgettable Dizziness
by Mike Kopf, p. 10-11, 17
Review of G.H. Fleming’s book, “The Dizziest Season” (about 1934 NL St. Louis) - Batter’s Offensive Wins and Losses
by Neil Munro, p. 12-17
Runs Created Formulas; 1920 AL Leaders in Offensive Wins; 1993 NL and AL Leaders in Offensive Wins Above .500; Career Leaders in Offensive Wins Minus Offensive Losses; Season Leaders in Offensive Wins Minus Offensive Losses. Using Runs Created to convert to Offensive Winning Percentage; Calculating the Number of Outs in a Game. Notes: Some nice OW% info, including historical; discussion of outs. - Distribution for Players’ Offensive Performance Statistics
by Charles Hofacker, p. 18-20
Formula for performance deviating from League Mean; Figures: Frequency Polygon for HR/AB, frequency of players with a certain percentage of HR, Frequency Polygon for H/AB, frequency of players with a certain BA, Frequency Polygon for 1B/AB, frequency of players with a certain percentage of 1B/AB. (Based on 1982 season? – not clear) Named Person(s): Ward Larkin (10/82 Baseball Analyst) Topics: Determining the relative frequency of certain events (and what is the curve – normal, etc.?) Notes: mostly mathematical; comparing large amounts of data with theoretical curves.
Issue 15-December 1984
- Base on Balls Abstract, Part II
by Craig Wright, p. 4-18
Walks in Career Context
– 4A) 24 Individual Tables of (Walk Ave/League Walk Ave) by Age
– 4B) Summary Charts for groups of 10 (Lo, Med, Hi) of (Walk Ave/League Walk Ave) by Age
– 4C) Tables with 1982 and 1983 offensive stats (AB, H, BA, etc.) for sets of players with different walk frequencies
– 4D) Table comparing two similar players who came up at age 20 but one walked more, and how they did in their 1st 3 seasons
– 4E) 8 Tables of (Walk Ave/League Walk Ave) by Age, 4 each for careers with rising BB% and steady BB%
– 4F) Summary Charts for the 2 sets of 4 each given in 4E for (Walk Ave/League Walk Ave) by Age, and for (HRC%/ HRC% of league)
– 4G) Table of Pete Rose’s performance in years when he walked frequently vs. other years
– 4H) Table of Ernie Whitt’s performance in years when he walked frequently vs. other years - Largest Metropolitan Areas with No Local Major League Baseball
by Daniel Greenia, p. 10
Table of Metropolitan population of largest areas without ML Teams (shows teams within 50 miles); also lists 4 smallest areas with teams. Large Markets without Teams; Small Markets with Teams - Hall of Fame Candidates
by Daniel Greenia, p. 18
Top 3 in HR, RBI, BA, R, H, SL%, G, TB, BB who are not in the HoF, though eligible. Highest ranking players in offensive categories who are not in the HoF but eligible. - Some Further Aspects of the Distribution of Runs
by Dallas Adams, p. 19-20
On Home Team’s Probability of Losing when the game enters extra innings and on Home Team’s Probability of losing when it enters the bottom of an extra inning trailing by “I” runs or tied 8. Topics: Probabilities of a team winning (or losing) in extra innings (follow-up on Feb 83 Baseball Analyst paper by Adams)
Issue 16-February 1985
- Letters
p. 1-3
Letter from Charles Pavitt responding to Dan Rappoport’s critique of his article in an earlier issue on correlation and simple regression. Also a fictional letter from Cuthbert Magnolia on various theories in “savvymetrics”. - Base on Balls Abstract, Part III
by Craig Wright, p. 4-10
Table of Burt Shotton’s effect on his clubs’ SB, BB, p%; HR. Learning to Walk (Manager’s effect on clubs propensity to take BB) - Percentage Baseball Reconsidered: Model and Method
by Charles Pavitt, p. 11-16
Tables of Offensive States (e.g. Runners on base vs. outs; Markovian matrix of which states can turn into which other states: “First Order Transition Matrix for On-Base Out/Situations” Playing the Percentages, Probablilities of Scoring Runs, Multi-Order Finite State Transition Model - Meteors
by Daniel Greenia, p. 16
Table of players who have hit over 25% of their career HR in one 30+ HR season - BA Comparison of Two Consistent Teams
by Jack Carlson, p. 17-20
Comparing 1984 Detroit Tigers and 1984 Pittsburgh Pirates Won-Loss vs. Runs Scored, Won-Loss by Run Differential, and Scoring by Inning
Issue 17-April 1985
- Review: “The 1985 Elias Baseball Analyst”
by Jim Baker, p. 2
A review from the editor of the new book “The 1985 Elias Baseball Analyst” - Technique of Run Estimation by Game-Line Assembly
by Bill James, p. 4-9
Developing an alternative method of estimating the number of runs likely to result from the offensive contributions of any individual player. - Notes on the Stolen Base: 1984 Ranger Games
by Craig Wright, p. 10-14
Assessing the run value of stolen bases and failed stolen base attempts by the Texas Rangers in 1984 games. - The All-Time Most Valuable Players
by Neil Munro, p. 15-19
Developing a method to determine the cumulative voting results for MVPs since 1931 and selecting MVP all-star teams. Musial,Stan; Williams,Ted; Ford,Whitey; Most Valuable Player; Selection Process - Letter
by Dan Rappoport, p. 20
Responding to Jack Carlson’s article in the previous issue. 1984; Pittsburgh Pirates
Issue 18-June 1985
- Comparing Statistics From Different Eras
by Alden Mead, p. 4-9
Era Comparison; Batting Average; Relative Batting Averag - Pitcher Burnout(?)
by Daniel Greenia, p. 9
Martin, Billy; Fowler, Art; Pitchers; Complete Game - Some Additional Comments on The Benefit of Getting the Leadoff Batter On Base
by Dallas Adams, p. 10-12
Leadoff; Run Production - Quantity vs Quality: A Look at Linear Weights Per Game
by Dan Heisman, p. 13
Linear Weights - Divergence of Won-Loss Records
by Scott Segrin, p. 14-18
Won-Lost Record; Relief Pitching; Scoring - New Worlds to Conquer
by Mike Kopf, p. 19-20
Dollar Sign on the Muscle; Scouting; Review - A Note to Fellow Sabermetricians
by Scott Segrin, p. 20
Elias Baseball Analyst; Review
Issue 19-August 1985
- Some Comments on the June Issue
by Craig Wright, p. 4-5
Martin, Billy; Fowler, Art; Pitchers; Complete Game; Era Comparison; Batting Average; Elias Baseball Analyst - Comment on All-Time MVP
by Dan Rappoport, p. 5-6
Most Valuable Player; Selection Process - A Report on the Accuracy of the Brock4 Career Projection Method
by Dallas Adams, p. 7-13
Career Projection; Brock4 - A Note About “Percentage Baseball Reconsidered”
by Mark D. Pankin, p. 14-15
Percentage Baseball; Markov Chain - Six Phases of a Baseball Research Project
by Dan Rappoport, p. 15
Humor - An Attempt at Determining Runs Batted In Efficiency
by Terry Bohn, p. 16-17
Run Batted In; Run Production - Quantity vs Quality: A Look at Linear Weights Per Game
by Dan Heisman, p. 18-19
Linear Weights
Issue 20-October 1985
- Into the Baseball Mind’s Eye
p. 2
Humorous article from “X.X. Ludeman” on the end of the 1985 season - Letters
p. 4-5
Letters from Dan Greenia, Craig Wright, L.W. Beach and Robert Johnson commenting on the previous issue. - Freak Show: Strikeouts/Home Run: Good & Bad
by Daniel Greenia, p. 6
A list of the best and worst all-time career strikeout/home run ratios. - Ground Ball Pitchers on Artificial Turf
by Craig Wright, p. 7-11
Debunking the myth that artificial surfaces are “deadly” to ground ball pitchers. - Another Look At Ground Ball Pitchers on Artificial Turf
by Craig Wright, p. 12-20
The author discusses his research methodology in the previous article and on a similar Bill James study that appeared in the “Baseball Abstract Newsletter”
Issue 21-December 1985
- Casey Studied Further
by Jim Baker, p. 2
A humorous look at what happened to the fictious Mudville teammates in “Casey At The Bat” - Freak Show: Won-Lost % of Expansion Teams
by Daniel Greenia, p. 4
A chart looking at the win-loss records of expansion Teams since 1961 - A Response to Mark Pankin’s “A Note About ‘Percentage BB Reconsidered’”
by Charles Pavitt, p. 5
The author responds to Mark Pankin’s critique of his article in an earlier issue. - Changes in Productivity as Players Age
by Bill James, p. 6-13
Studying a defined group of players and identifying the changes that take place in their performance as they age. - Additional Fielding Statistics from Play-by-play Data
by Clem Comly, p. 14-17
Using play-by-play from 1983 Phillies home games, the author looks at pitchers versus the running game, infielders’ and outfielders’ range factors and other interesting studies that could now be done as Project Scoresheet expanded its data and scope. - Armchair at the Bedside
by Mike Kopf, p. 18-20
Review: “The Armchair Book of Baseball”
Issue 22-February 1986
- Letter
by Craig Wright, p. 2
The author and frequent “Analyst” contributor discusses his decision to leave the Texas Rangers. - Synchronicity and the Double Play
by Dick O’Brien, p. 4, 20
Questioning the possible overuse of “the double play strategy” by managers. - Observations on the Stolen Base
by Craig Wright, p. 5-9
Using 1984 data from Project Scoresheet, the author studies stolen bases, broken down by league, pitcher handedness, attempts and pickoffs. - Peripheral and Identifying Characteristics of Ground-Ball and Fly-Ball Type Pitchers
by Bill James, p. 10-16
Developing new ways to classify ground-ball and fly-ball pitchers, using ratios released in the “Elias Baseball Analyst”. - Run Estimation by Game-Line Assembly
by Mark D. Pankin, p. 17-20
Offering corrections to Bill James’ article in the previous issue on estimating run production.
Issue 23-April 1986
- Letter
p. 2, 18, 19, 20
Fictional letter to the editor from “Manny Mannitillo” - Some Reflections on the “Iorgy of Recrimination”
by Mike Kopf, p. 4-8
The author reflects on his experience at Game Six of the 1985 World Series, and makes an impassioned appeal to all Project Scoresheet participants. - The Baseball Batting Sequence Problem
by Jess Boronico, p. 9-17
Taking a further look at how batters should be arranged in the lineup, in response to a study that says they should be arranged by order of decreasing production.
Issue 24-June 1986
- Run Production and Run Prevention Correlated to Wins
by David F. Hoppes, p. 4-6
Won-Lost Record; Run Production - Bias in Infielding evaluation 1: Pitching Handedness
by Charles Pavitt, p. 7-11
Fielding;Pitcher Handedness;Total Chances - The Size and Nature of The Platoon Differential
by Tom Hanrahan, p. 12-16
Platoon Differential - Ball Park Elevation and Humidity as Factors in Home Run Production
by Dick O’Brien, p. 17-18
Home Runs;Park Factor;Weather;Elevation;Minor Leagues - Reaction To Dick O’Brien’s Article
by Bill James, p. 19-20
Home Runs;Park Factor;Weather;Elevation;Psychology;Minor Leagues
Issue 25-August 1986
- Computers and the Ballgame
by Tony Formo, p. 2-5
Computers - Why Right-Handed Hitters are Better High-ball Hitters and Left-Handed Batters are Better Low-ball Hitters
by Dick O’Brien, p. 6-7
Platoon;High Ball Hitter; Low Ball Hitter;Hitting - Some Random Thoughts on Baseball and Ballplayers
by Mike Kopf, p. 8-10
Gossage, Goose;Kroc, Joan Comiskey Park;Owners;Books;Humor - How Long Do Players Spend in the Minor Leagues?
by Bill James, p. 11
Minor Leagues - Some Thoughts on Project Scoresheet
by Tony Formo, p. 12-14
Project Scoresheet
Issue 26-October 1986
- Cloudland Revisted
by Dick O’Brien, p. 2-5
Strikeouts; Run batted in - Batting Leadoff For St.Louis: George Foster
by Timothy Morway, p. 6-7
Coleman, Vince Leadoff;Line Up - Percentage Baseball Reconsidered: 2. Preliminary 1984 Findings
by Charles Pavitt, p. 8-19
Baseball;Markov Chains;Project Scoresheet;Run Production
Issue 27-February 1987
- Tip O’Neill: Estimating His 1887 RBIs
by Dallas Adams, p. 2-3
O’Neill, Tip Run Batted In;Linear Weights - A Look at ‘Turf’ Teams and ‘Turf’ Players: 1983-1986
by Sandy Sillman, p. 4-7
Turf;Park Factor - The Implications of Leadership Research on Baseball: 1. Past Research
by Charles Pavitt, p. 8-11
Managers;Managerial Change;Management - Some Relief Pitching Statistics from 1986
by Philip Meneely, p. 12-20
Relief Pitching;1986;Pitching Staffs;Inherited Runner;Holds;Saves
Issue 28-March 1987
- Scoring From First on a Double or Second on a Single
by Dallas Adams, p. 8-10
Base Running;Run Production - Why Making Double Plays is an Important Part of Fielding Skill
by Dan Finkle, p. 10-13
Double Play;Fielding;Fielding Index - Suggestions for Areas of Research
by Bill James, p. 2-7
Mattingly,Don; Aging;Hall of Fame;Iron Man;Minor League Leaders;Race - Looking at the 1987 Rookie Crop
by Bill James, p. 18-26
1987;Rookies;Major League Equivalencies - Hall of Fame and a New Historical Ranking of the All-Time Greats
by Robert K. McCleery and Robert O. Wood, p. 14-17
Hall of Fame;Ranking
Issue 29-April 1987
- What Type Team Spells R-E-L-I-E-F Best
by Russ Eagle, p. 2-5
Relief Pitching;Saves - A New Framework for Assessing Individual Offensive Performance
by David Smyth, p. 6-8
Run Production - The Further Adventures of Clutch Hitting
by Dick O’Brien, p. 9-11
Clutch Hitter - The Effect of Relief Pitchers on Aggregate Batting Averages
by Robert E. Shipley, p. 12-20
Relief Pitching
Issue 30-June 1987
- Improving the Runs Created Formula
by David H. Robinson, p. 2-6
James,Bill;Johnson,Paul; Runs Created - Miracle Teams and Long Shots:What are the Odds?
by Sandy Sillman, p. 7-10
Miracle Teams;Odds - Some Comments on Charles Pavitt’s “Bias in Fielding Evaluation 1: Pitcher Handedness”
by Dallas Adams, p. 11
Fielding;Pitcher Handedness;Pitcher Fielding - All-Time Greats Consensus
by Daniel Greenia, p. 12
Rankings - Implications of Leadership Research on Baseball 2: Current Theory
by Charles Pavitt, p. 13-16
Manager;Leadership - On the Innaccuracy of the Pythagorean Equation at Extreme Scoring Ratios
by Dallas Adams, p. 17-18
Pythagorean Projection;Offensive Winning Percentages - Strikeout-to-Walk Ratios and Winning Records
by Russ Eagle, p. 19-20
Strikeout-to-Walk Ratio
Issue 31-August 1987
- Similarity Scores Among the All-time Greats
by Robert K. McCleery and Robert O. Wood, p. 2-6
Similarity Scores;Hall of Fame - On Batting Order
by Doug Bennion, p. 7-11
Line up;Run Production - Bias in Infielding Evaluation 2: Pitching Handedness and Strikeout Tendencies
by Charles Pavitt, p. 12-15
Fielding; Pitching; Strikeouts - Late Home Run Hitters
by Stephen Roney, p. 16
Home Run; Age - Using a Baseball Simulator Program to Calculate Batter Runs Created
by Dallas Adams, p. 17-20
Ruth, Babe; Runs Created;Run Production;Computer Simulations;Offensive Winning Percentage
Issue 32-October 1987
- Hitter Controlled or Pitcher Controlled
by Bill James, p. 1
Thoughts on trying to calculate to what extent each area of run production is controlled by hitters or pitchers. - A Preliminary Review of Outside Influences on Rich Ashburn’s Fielding Statistics
by Bruce H. Garland, p. 3-8, 11
Studying the defensive abilities of Richie Ashburn and the effects of his home ballpark, Connie Mack Stadium; his teammates, including Del Ennis; the National League averages at the time; and other factors. - 1987: How the East Was Won
by Russ Eagle, p. 9-11
Studying how the St. Louis Cardinals created their runs on their way to the 1987 NL East division title. - Pitcher’s Defensive Wins and Losses
by Neil Munro, p. 12-17, 20
Trying to determine the number of defensive wins and losses that a pitcher contributes to his team over the course of a season. - Formulas: Awards
by Tom Hanrahan, p. 18-20
Proposing new formulas for predicting who might win postseason awards, including Most Valuable Player; Cy Young Award; and Manager of the Year.
Issue 33-December 1987
- Alternatives for Career Projection
by Bill James, p. 2-4
Seeking alternatives for career projection systems over the previously used 1Brock.wk1 system and developing a “target-oriented” system. - The 1988 Hall of Fame Ballot
by Robert O. Wood, p. 5-9
Looking at the eligible candidates and predictions for the 1988 National Baseball Hall of Fame ballot. - Research in Progress
by Bill James, p. 10-15
Reporting on the accuracy and improves of the author’s 1Brock.wk1 career projection system. - Sending the Runner
by Doug Bennion, p. 16-20
Studying the wisdom of sending a runner from first base on a full count with zero or one outs.
Issue 34-February 1988
- Run/Opposition Run Connection
by Bill James, p. 1-3
Run Production;1987;Score - Sustained Illusions in Platoon Effects
by Bill James, p. 3-4
Platoon - Markov Chain Models: Theoretical Background
by Mark D. Pankin, p. 5-10
Markov Chain Model; Expected Runs - On The Relief Pitcher’s ERA Advantage
by Phil Birnbaum, p. 11-16
Hernandez,Willie; Quisenberry,Dan; Righetti,Dave; Henke,Tom; Relief Pitcher; Earned Run Average; Expected Runs; Pitching Changes - Home Run Miscellany
by Stephen Roney, p. 17
Homeruns;1987:Age - Hitter Control vs Pitcher Control
by Russ Eagle, p. 18-20
Pitching;Batting
Issue 35-April 1988
- The Effect of Being Traded on Batting Performance: More Academic Baseball Research
- by Charlie Pavitt, p. 2-3
Murcer, Bobby Trade;Review;Psychology;Experience - By the Stars
by Bill James, p. 4-5
Astrology;Similarity Scores - Independent Situations and Baseball Statistics
by Dan Heisman, p. 6-7
Clutch Hit;Game-Winning RBI;Victory-Important RBI;Pressure - Are Hall of Fame Standards Declining?
by Bill James, p. 8
Hall of Fame Selecting - Rabbit Ball Revisited
by Joe Mangano, p. 9-14
Rabbit Ball;1987 - Reflections of a Megalomaniac Editor: Managerial Changes
by Bill James, p. 15
Review;Managerial Change - Reflections of a Megalomaniac Editor: Ballpark Elevation and Humidity
by Bill James, p. 15
Park Factor;Weather;Elevation - Reflections of a Megalomaniac Editor: Effect of Being Traded on Batting
by Bill James, p. 16
Trade;Review - Reflections of a Megalomaniac Editor: Independent Situations
by Bill James, p. 16-18
Clutch Hit;Pressure;Review - Reflections of a Megalomaniac Editor: Rabbit Revisited
by Bill James, p. 18-20
Rabbit Ball;Review;Balata Ball;Dead Ball;Lively Ball
Issue 36-June 1988
- Baseball’s Hall of Fame Voting System
by Robert O. Wood, p. 2-5
Hall of Fame Selecting - A Brief Look at Left-Handed Pitching Effectiveness
by Dick O’Brien, p. 6-7
Left-Handed Pitcher - Lefties vs Lefties: As Time Goes Bye
by Tom Locker, p. 8-9
Platoon;Left-Handed Batter - Debunking a Pitching Clichè
by Dallas Adams, p. 10-11
Run Production;Pitching - Note on “Lefties vs Lefties”
by Bill James, p. 11
Rookies;Platoon;Left-Handed Batter - Predicting Team Performance: Beyond Pythagorean
by Robert Cramer, Robin Ellins and David Lutz, p. 12-14
Pythagorean Projection;Run Production;Winning - Response to Cramer, et al
by Bill James, p. 15
Run Production - Adventures in Computer Simulations
by Gary Fletcher, p. 16-20
Lineup;Simulations;Run Production
Issue 37-August 1988
- Introduction, with comments on Heisman, “Independent Situations”
by Bill James, p. 1-2
Pressure Situations;Baseball Abstract - Ballpark Effects on Home Runs
by Robert K. McCleery and Robert O. Wood, p. 3-6
DiMaggio,Joe;Dawson, Andre - Late Home Run Hitters Revisited
by Stephen Roney, p. 7-8
Home Runs;Age - Leadoff Man and His Effect on the Lineup
by Gary Fletcher, p. 9-11
Line Up;Runs Created;Leadoff;Simulations - Why Everyone Wants Lefty Pitching
by Dick O’Brien, p. 12-13
Left-Handed Pitcher - Thirty-Homer Guys: A Four Part Study
by Bill James, p. 14-20
Canseco, Jose;Kingman,Dave; Home Runs;Similarity Scores
Issue 38-October 1988
- Player Win Averages: An Extended Book Review
by Paul R. Pudaite, p. 2-7
Player Win Averages;Run Production;Clutch Hitter - Predicting Ws and Ls from Runs Scored and Allowed
by Willie Runquist, p. 8-9
Soolman;Cook,Earnshaw Win-Loss Record;Pythagorean Projection - Response to “Predicting Ws and Ls from Runs”
by Bill James, p. 10
Soolman;Cook,Earnshaw Win-Loss Record;Pythagorean Projection - Fred McMullin: An Underrated Crook?
by Mike Kopf, p. 11
McMullin, Fred; Chicago White Sox;Black Sox;1919 World Series - Peer Comparison System
by Andy Spark, p. 12-15
Comparison - Intra-season Statistical Trends
by Dallas Adams, p. 16-18
1987;Statistics - Hall of Fame Note
by Bill James, p. 19-20
Hall of Fame Selecting
Issue 39-December 1988
- An Addendum to Bruce Garland’s Preliminary Review Of Outside Influences on Rich Ashburn’s Fielding Statistics
by Bill Carr, p. 2-3
Ashburn, Richie;Roberts, Robin Outfield;Fielding - Breaking in a Catcher
by Tom Hanrahan, p. 4-6
Catcher;Earned Run Average - Pitcher Run Average
by Doug Bennion, p. 7-10
Earned Run Average;Pitcher Run Average;Run Potential - Racism in Baseball: Offensive Performance
by James R. McNesby, p. 11-15
Racism - Parity: A New Look
by Robert K. McCleery and Robert O. Wood, p. 16-20
Parity; Law of Competitive Balance;Luck;Expansion
Issue 40-February 1989
- Clutch Situations
by Tom Hanrahan, p. 2-3
Run Production;Base Situation;Run Potential;Clutch Hitter - How I Screwed Up
by Gary Fletcher, p. 4-5
Runs Created;Simulations - Validating Simulation Programs: Some Benchmarks
by Kenneth McLain, p. 6-7
Runs Created;Simulations;Run Production - Home Field Advantage Revisted
by Jim Heg, p. 8-13
Home Advantage;Win-Loss Record;Pythagorean Projection - On Why Teams Don’t Repeat
by Phil Birnbaum, p. 14-20
Win-Loss Record;Luck;Talent;Whirlpool Principle;Plexiglass Principle